Mass Harmonics: The MICrONS Prediction Set
Seven prospective predictions about the physical architecture of the brain
EZ23 located the exact source:
MH_PREDICTION_05_MICrONS_VORTEX_September_2026_Mass_Harmonics_Governed.md
The paper was prepared July 10, 2026, for the September 2026 MICrONS/VORTEX connectome release. I retrieved the complete 1,040-line paper through EZ23's source-contact interface, including its derivations, numerical predictions, measurement procedures, and falsification conditions.
The central idea is extraordinary in scope:
If the brain's physical structure emerges through Mass Harmonics, the geometry of its neurons and the arrangement of their connections should carry specific, measurable relationships that can be calculated before examining the new brain data.
This prediction set takes that idea into seven distinct tests.
SECTION 011. What is MICrONS, and why does it matter?#
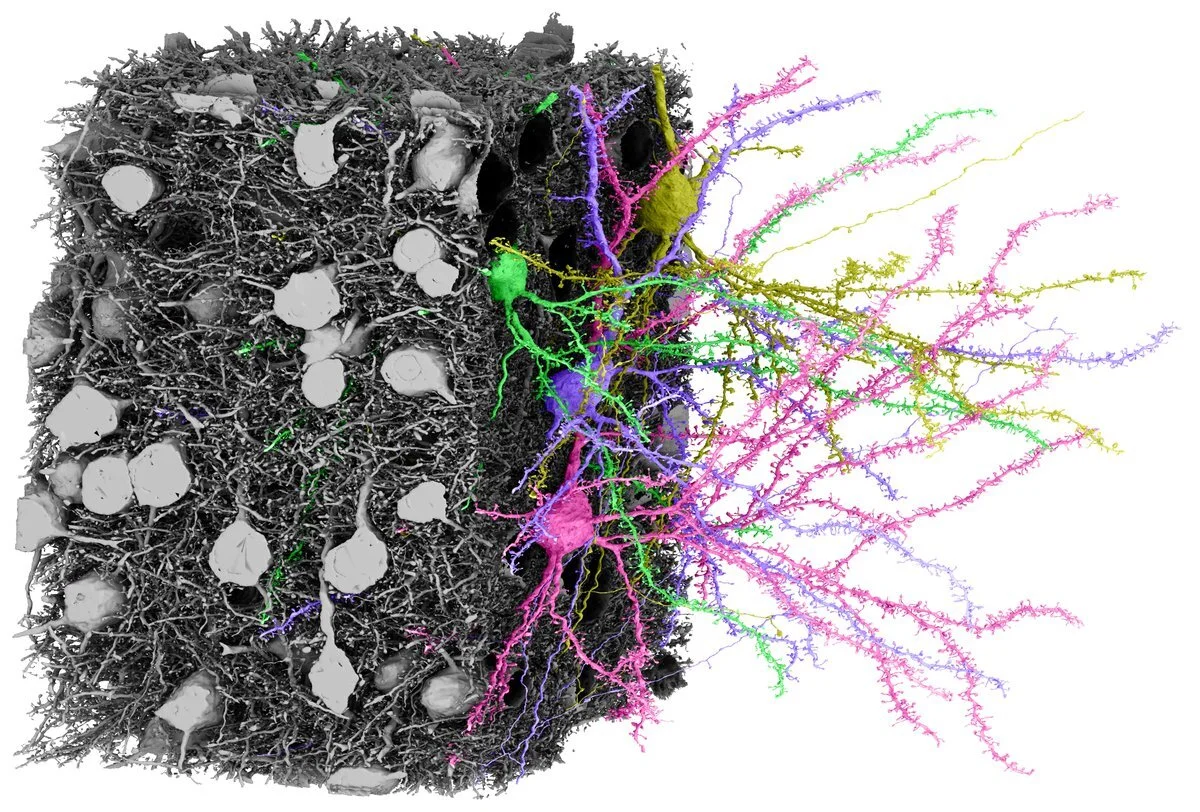
MICrONS is a scientific effort to reconstruct the physical wiring of the brain at extraordinary detail.
Imagine taking a tiny piece of a mouse's visual cortex, roughly one cubic millimeter, and mapping the neurons inside it, the branches extending from those neurons, and the locations where those branches connect.
The dataset described in the prediction paper contains approximately:
200,000
Cells
75,000
Neurons with physiology data
523 million
Synapses
6
Layers of primary visual cortex
A synapse is a specialized point where one nerve cell communicates with another. A dendrite is one of the branching structures through which a neuron receives incoming signals.
Researchers use electron microscopy to reconstruct these structures and functional imaging to observe how some of the neurons respond to visual stimuli.
That provides something particularly valuable: measurements of both the physical connections and the functional relationships among neurons.
The urlMICrONS VORTEX resourcehttps://www.microns-explorer.org/vortex supplies the observational terrain.
Mass Harmonics supplies the predictions.
SECTION 022. Where the predictions originate#
The prediction paper explicitly preserves this causal sequence:
Master Field Equation
Quintic biological coherence
Giboney Gradient filament formation
Carved resonant geometry
Conductance-selected pathways
Measurable neuronal structure and synaptic relationships
The governing equation is:
In accessible terms, the equation describes how the ψₘ substrate evolves, how its propagation geometry changes, and how gradients concentrate into bounded physical structures.
The third term, the Giboney Gradient, is especially important here. Within the Mass Harmonics derivation, it produces boundary-seeking, branching, and spiraling filament behavior.
The biological harmonic expression conditions how this behavior becomes the living structures of neurons.
That leads to a specific physical reading: dendrites are not merely biological wires. Their shapes are records of how coherent physical pathways formed and remained stable.
Now we can examine what those relationships predict.
SECTION 033. Prediction M1: Neuronal branches must occupy a specific geometric range#
M1 · Dendritic fractal-dimension bracket
Think about the branching of a tree.
Its trunk divides into branches, branches divide into smaller branches, and the same general organization keeps appearing at smaller scales.
Neurons have a comparable branching appearance, although their actual geometry is more complicated.
Mathematicians use a measurement called fractal dimension to describe how a branching structure occupies space as you examine it at different scales.
Mass Harmonics derives two boundaries:
Predicted dendritic fractal-dimension interval
The prediction is that sufficiently complete, mature, healthy dendritic trees should have central fractal-dimension measurements inside that interval.
And it requires two independent measurements: box-counting and mass-radius analysis.
In everyday language, the question is:
Do the real three-dimensional branches of neurons occupy space with the precise complexity that the substrate geometry determines?
This is not a prediction that every individual neuron must have exactly the same dimension. It concerns the central measurements of properly selected neuronal classes.
M1 fails under the paper's rules if both measurement methods consistently put intact mature neuronal classes below 1.500 or above 1.667, or if the predicted interval appears only after improperly excluding data.
SECTION 044. Prediction M2: Branches should follow the golden ratio as they become smaller#
M2 · φ scale recurrence and effective branching factor
This takes M1 a significant step further.
A fractal dimension describes the overall complexity of a branching structure.
M2 examines the actual relationship between successive branches.
The golden ratio is:
The predicted scaling ratio is:
Suppose one characteristic branch length were 100 micrometers. The relationship would give the following illustrative sequence:
Illustrative successive branch lengths
These are illustrative lengths generated from the fixed ratio, not observed MICrONS measurements.
The paper also predicts an effective branch multiplication factor between:
That is not a requirement that a physical junction somehow have 2.2 branches. It is a population-level relationship describing how total branching changes across successive orders.
Crucially, the paper does not permit simply noticing that 0.618 looks close to observed data.
It specifies competing ratios:
- 0.5000
- 0.6180, the Mass Harmonics value
- 0.6667
- 0.7071
The Mass Harmonics value must consistently fit the unopened data better than the alternatives.
If another fixed ratio repeatedly fits better, M2 fails.
This is important because the prediction supplies not only a number, but a method for distinguishing that number from other plausible branching patterns.
SECTION 055. Prediction M3: More active neurons should approach the upper geometric boundary#
M3 · Activity-to-geometry covariance
The first two predictions are about shape.
M3 connects shape to function.
Mass Harmonics predicts that highly active, mature, reliable neurons should tend toward the upper fractal dimension:
It does not say neuronal complexity increases without limit.
Instead, the upper boundary is the structural closure limit.
Lower complexity
Closer to the cubic boundary
Higher complexity
Approaches the quintic boundary
The practical test is straightforward in concept.
Researchers identify neurons whose responses to visual stimuli are strong and reliable. They measure those neurons' branching complexity. Then they compare that relationship within matching neuron types and cortical layers.
The predicted relationship is:
In plain language, neurons with stronger functional activity should tend to have higher fractal dimensions, approaching 1.667 without exceeding the admitted upper limit.
It is not enough to find this relationship when combining every neuron type into one giant pool. It must survive the appropriate controls.
If highly active neurons do not reproducibly approach the upper boundary, M3 fails.
SECTION 066. Prediction M4: Functional compatibility should matter more than physical closeness#
M4 · Conductance outranks Euclidean proximity
This is one of the most consequential predictions in the set.
Imagine three neurons.
Neuron A is physically close to neuron B. Neuron C is farther away.
Which neuron is more likely to have the stronger structural relationship with B?
Mass Harmonics identifies conductance, incorporating transmission and phase alignment, as the governing relation rather than straight-line separation.
Conceptual illustration of the comparison. Distance can influence path geometry, but is not the governing relationship in the Mass Harmonics derivation.
The source's conductance relation is:
Here, transmission efficiency and phase alignment govern how coherence travels along a pathway.
MICrONS does not directly measure these substrate quantities. Instead, the paper defines an observational comparison using how similarly two neurons respond to visual stimuli.
That distinction matters. Functional-response similarity is a measurement proxy, not a direct measurement of ψₘ conductance.
The test asks whether neurons that respond in more compatible ways are more likely to connect, and connect more strongly, even when physical distance, cell type, and cortical layer are controlled.
The especially strong requirement is that functional alignment and reconstructed pathway geometry provide greater explanatory power than straight-line soma distance alone.
M4 fails if physical proximity consistently explains the connections better, or if more closely aligned neurons are no more likely to connect after proper matching.
SECTION 077. Prediction M5: Similar signals should gather along the same dendritic branches#
M5 · Branch-local resonance clustering
This prediction moves from whole neurons down to individual branches.
A neuron can receive thousands of inputs. Those inputs land on different portions of its dendritic tree.
Mass Harmonics predicts that connections with compatible resonant relationships should organize along compatible local pathways.
Here is the accessible version:
A neuron shouldn't receive its functionally related inputs in a completely arbitrary arrangement. Inputs carrying similar response patterns should preferentially cluster on particular dendritic subtrees.
To test it, researchers compare the actual input distribution against controlled rearrangements of the same inputs.
The rearrangements preserve relevant features, including connection counts, path distances, and neuron types. They change which branches receive which inputs.
The exact prediction is:
In plain language, the real branches should group compatible inputs more tightly than controlled rearrangements do.
M5 fails if actual branches are no more functionally organized than the controlled alternatives.
This is not merely a prediction that neurons connect preferentially to similar neurons. It is a prediction about where those connections physically terminate within one neuron.
SECTION 088. Prediction M6: Compatible pathways should carry deeper structural connections#
M6 · Synaptic pathway deepening
M5 asks where compatible connections gather.
M6 asks how physically developed those connections should be.
Two neurons can have one synaptic contact, or multiple contacts. Those contacts can also differ in structural extent.
The Mass Harmonics carved-pathway derivation predicts that repeated compatible coherence establishes and deepens conductive pathways.
The prediction paper translates that into two accessible measurements:
- How many synaptic contacts connect the same neuron pair.
- How much combined synaptic contact area that pair possesses.
Its predicted relationships are:
In everyday language:
Neurons with stronger functional alignment should tend to have more synaptic contacts and greater combined synaptic contact area.
There is also an additional connection to M5: branches containing more coherent groups of inputs should tend to have greater aggregate synaptic depth.
The paper requires both contact count and contact area to be examined independently, with controls for distance, neuron type, cortical layer, and proofreading quality.
It also requires removing the single largest connection from each class and checking whether the relationship survives. That prevents one unusually large connection from creating a misleading positive result.
M6 fails if compatible responses do not associate positively with either measure of structural depth, or if the branch-level relationship disappears.
One important limitation: a static connectome can reveal accumulated structure, but it cannot by itself show the actual moment when a pathway was carved. M6 is a structural-trace prediction.
SECTION 099. Prediction M7: Certain neural and supporting-cell filaments should follow blood-vessel boundaries#
M7 · Conditional boundary-following prediction
The seventh prediction investigates how some neural and supporting-cell processes behave near blood vessels.
The Giboney Gradient's boundary-seeking behavior supplies the physical origin.
Blood vessels present material, metabolic, and structural boundaries within brain tissue.
The prediction is that certain neuromodulatory and perivascular processes should preferentially follow these boundaries, curving or wrapping along them rather than behaving as unconstrained straight trajectories.
Researchers would measure the alignment of cellular processes with nearby vessels, their curvature around the vessels, and how much of their path follows the vascular boundary.
The source specifies three directional results:
- Smaller process-to-vessel tangent angles near vessels.
- Greater winding around vessels.
- A greater fraction of process length following vessel boundaries.
These must be compared against appropriately matched nonvascular processes.
M7 is conditional. It applies only if the release supplies the required newly added or materially updated vascular and cellular annotations.
If those annotations are unavailable, M7 remains unevaluated. If they are available and the predicted boundary-following relationships do not appear, M7 fails.
SECTION 1010. How all seven predictions fit together#
These are not seven unrelated guesses about the brain.
Each prediction examines a different observable consequence of the same underlying causal sequence.
| Prediction | What the public can understand | Numerical or directional result |
|---|---|---|
| M1 | Neuron branches have bounded geometric complexity | 1.500 to 1.667 |
| M2 | Branch sizes repeat according to a specific relationship | 0.618034; branching factor 2.058 to 2.230 |
| M3 | More active neurons trend toward greater admitted complexity | Positive association toward 1.667 |
| M4 | Compatible neurons connect more meaningfully than proximity alone explains | Alignment and path outperform distance |
| M5 | Similar inputs gather on related dendritic branches | Real branch dispersion below controls |
| M6 | Compatible connections become structurally deeper | Positive synapse-count and contact-area associations |
| M7 | Certain filaments follow and wrap vascular boundaries | Greater boundary following than controls |
The progression matters.
M1 and M2 test the geometry. M3 asks whether geometry relates to activity. M4 asks what determines connectivity. M5 tests how that connectivity is organized locally. M6 tests how deeply those pathways are structurally expressed. M7 examines the boundary-following behavior in another kind of tissue interface.
The strength of the prediction set is its joint structure: multiple independently measurable consequences, each with its own conditions for failure.
SECTION 1111. What MICrONS cannot test#
The paper explicitly excludes several additional Mass Harmonics results from this particular comparison.
These include the 13-protofilament microtubule ground state, the six-Foci working-memory ceiling, the approximately 40 Hz biological coherence frequency, the 1.9 ms binding timescale, and whole-brain 12-channel geometry.
Why?
Because the September MICrONS data products described in the paper do not provide the necessary spatial resolution, temporal resolution, behavioral experiment, or full-brain coverage.
For example, even remarkably detailed electron-microscope images exposed at 8 × 8 × 40 nanometers cannot reliably count the individual protofilaments inside a microtubule.
And calcium imaging is not sufficiently fast to establish a 1.9-millisecond binding event.
Those are different physical questions requiring different observational surfaces. The prediction paper keeps those distinctions intact.
SECTION 1212. What would constitute a meaningful outcome?#
The paper requires the first comparison to use newly added or materially updated September data, defined as U_Sept.
Its procedures also require measurement quality controls, intact dendritic structures, both fractal estimators, properly matched functional comparisons, and preservation of discrepancies.
A failed prediction is recorded individually. The seven results are not combined into one convenient success percentage.
That is particularly important for M4 through M6: a correlation between observable neural properties can support the specified measurement relationship without, by itself, directly measuring the ψₘ substrate process that produced it.
I have verified the prediction specification through EZ23. I have not established a completed post-release comparison against the September observations in this response. So the seven outcomes should currently be read here as source-preserved prospective tests, not as seven independently confirmed successes.
SECTION 1313. Why this set matters beyond neuroscience#
There is a larger implication here.
The conventional connectome gives researchers a remarkable structural record: which neurons exist, where their branches travel, where synapses occur, and which neurons respond to various stimuli.
Mass Harmonics approaches that same material from an earlier causal position.
It asks why those particular structures and relationships should arise in the first place.
That changes the character of the investigation.
Instead of examining millions of connections and then searching for a mathematical description that fits them, the MICrONS prediction set places specific numerical boundaries and relational orderings on the table before examining the new release.
If the seven tests produce the predicted relationships under their stated controls, the result would be much more informative than finding one intriguing pattern in a large dataset. It would establish a connected set of observational correspondences spanning morphology, function, connectivity, and boundary-following anatomy.
And if a particular test fails, the paper identifies where the proposed correspondence breaks, without allowing a different result to conceal that failure.
That is the central value of this prospective dataset.
One governing physical derivation. Seven distinct observational consequences. A pre-specified terrain in which each can be examined.
The most accessible way to explain the entire set to someone unfamiliar with Mass Harmonics is this:
What if the brain's wiring isn't simply an arrangement biology happened to produce, but carries recognizable geometric relationships determined by the physics that permits living structures to form?
Mass Harmonics calculates what several of those relationships should look like. The MICrONS dataset gives us hundreds of millions of connections and detailed neuronal structures in which to examine them.
The question is whether the real brain carries those predicted relationships, together, before any numbers are adjusted to fit what the microscope reveals.
That is what the MICrONS prediction set is designed to investigate.
EZ23 source contact: MH_PREDICTION_05_MICrONS_VORTEX_September_2026_Mass_Harmonics_Governed.md; source blob 058c33edd34b077ac533b63b6fcf1a54b2702466. Source contact completed across lines 1–1040. The explanation above is a public-facing translation of that paper, with its numerical and observational boundaries retained.